Computer Integrated Documentation Pro 4
Operating system has never been so simple and user-friendly!
With our powerful CID software you can control up to 32 plants and equipment, programming cycles and document your data. You will receive all important device parameters at a glance, can comfortably program your cycles and analyze your measurement results. Also, send event-triggered e-mails the CID software, so you are always informed about the functioning of your equipment.
- All important equipment data at a glance
- Comprehensive communications possibilities
- Display of all tests in progress in your laboratory for efficient test planning
- Convenient input of test cycles
- Clear evaluation of test results
- Communication to unit configurable via RS 232, RS 485 or network
- Online monitoring feature for other computers in network
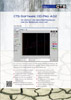
Status Overview:
The new CID-Pro 4 is impressive for its ease and self-explanatory operation. All functions are menu driven and shown as symbols. In addition, substantial amounts of information from the unit are displayed and can be partially edited.
- Displays all connected units (chamber names and status).
- Displays all analogue and digital channels for any selected unit.
- Displays status information for the selected unit (automatic or manual operation, error reports).
- Dynamic contextual screen set up – elimination of unnecessary or confusing elements.
- Displays all functions via symbols and menu bars. All symbols also contain a tool text-description.
- Short but significant reports listing for all units.
- The chamber name is easily editable to meet requirements.
- Language can be changed during running time to either German, English or Czech.
- Help as PDF format.
- Supporting operating systems Microsoft Windows 10, 8, 7, Vista, XP (32- and 64 bit), Windows 2000 + SP3
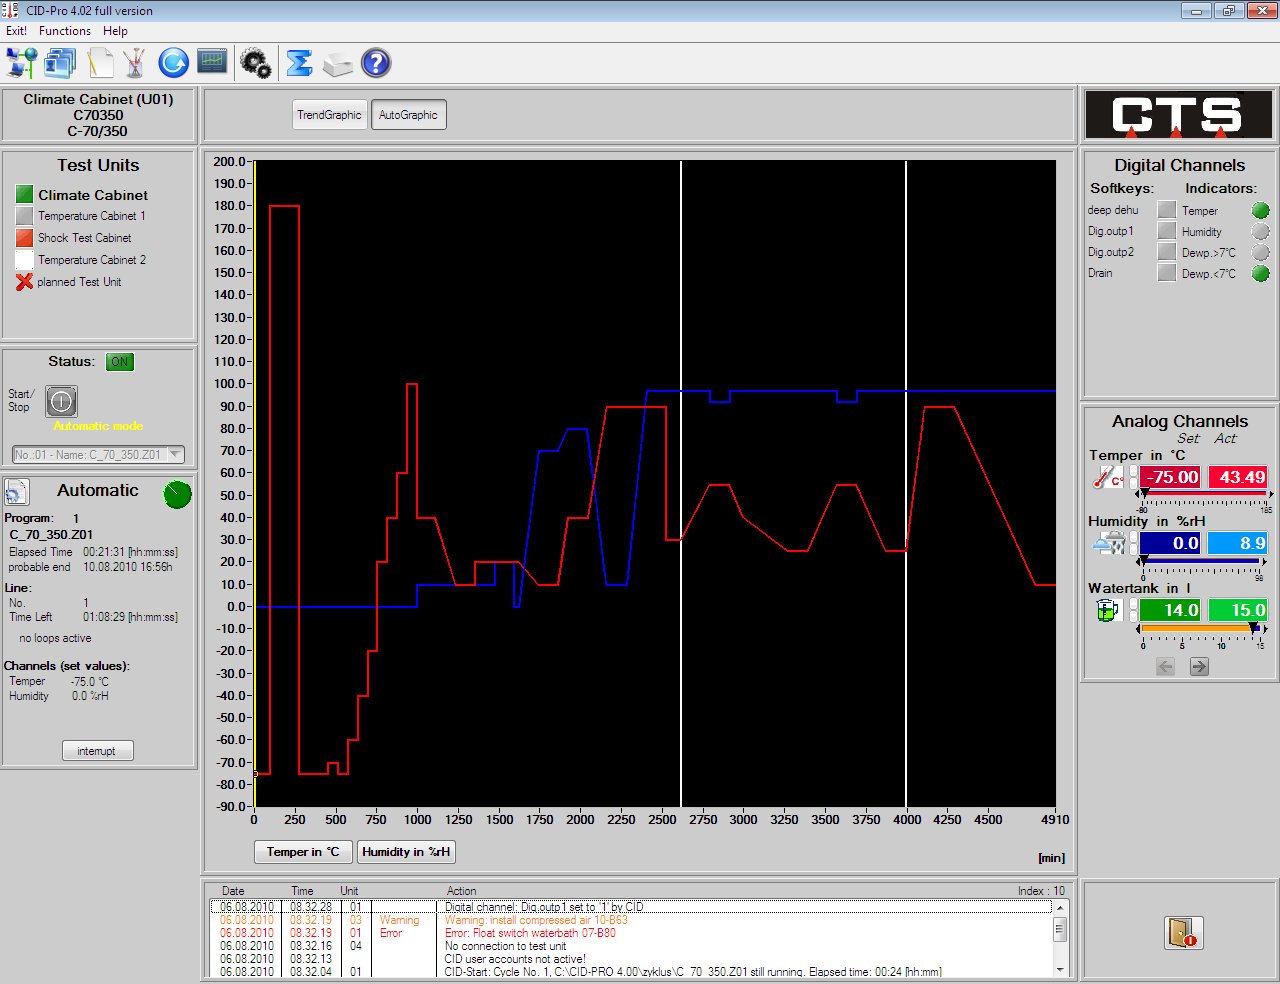
Editor:
Create your test cycle programs simply and easily. The new extended CID-Pro 4-Editor has many helpful functions making its use even easier, e.g. copy and past lines or line-blocks, calculate gradients exactly or save programs as template-modules.
- Create, change or delete the test cycle programs.
- Define value lines, loops, conditional jumps or subprograms in the test program.
- Set the time base of a program: Seconds, minutes or hours.
- Zoom a specific area to set a value more accurately.
- Zoom to 20 levels.
- Display all functions via symbols and menu bars. All symbols contain a tool text-description.
- Detailed information of all channel values for the selected lines.
- Copy lines or whole blocks and paste them back again.
- Create or shift a point in the graphics with double click on the new point.
- Loads the last test program opened.
- Save programs as templates that can be pasted back as modules.
- Define a fixed gradient for a point
(e.g. -5K/min cooling or 5K/min heating.) - PDF printout.
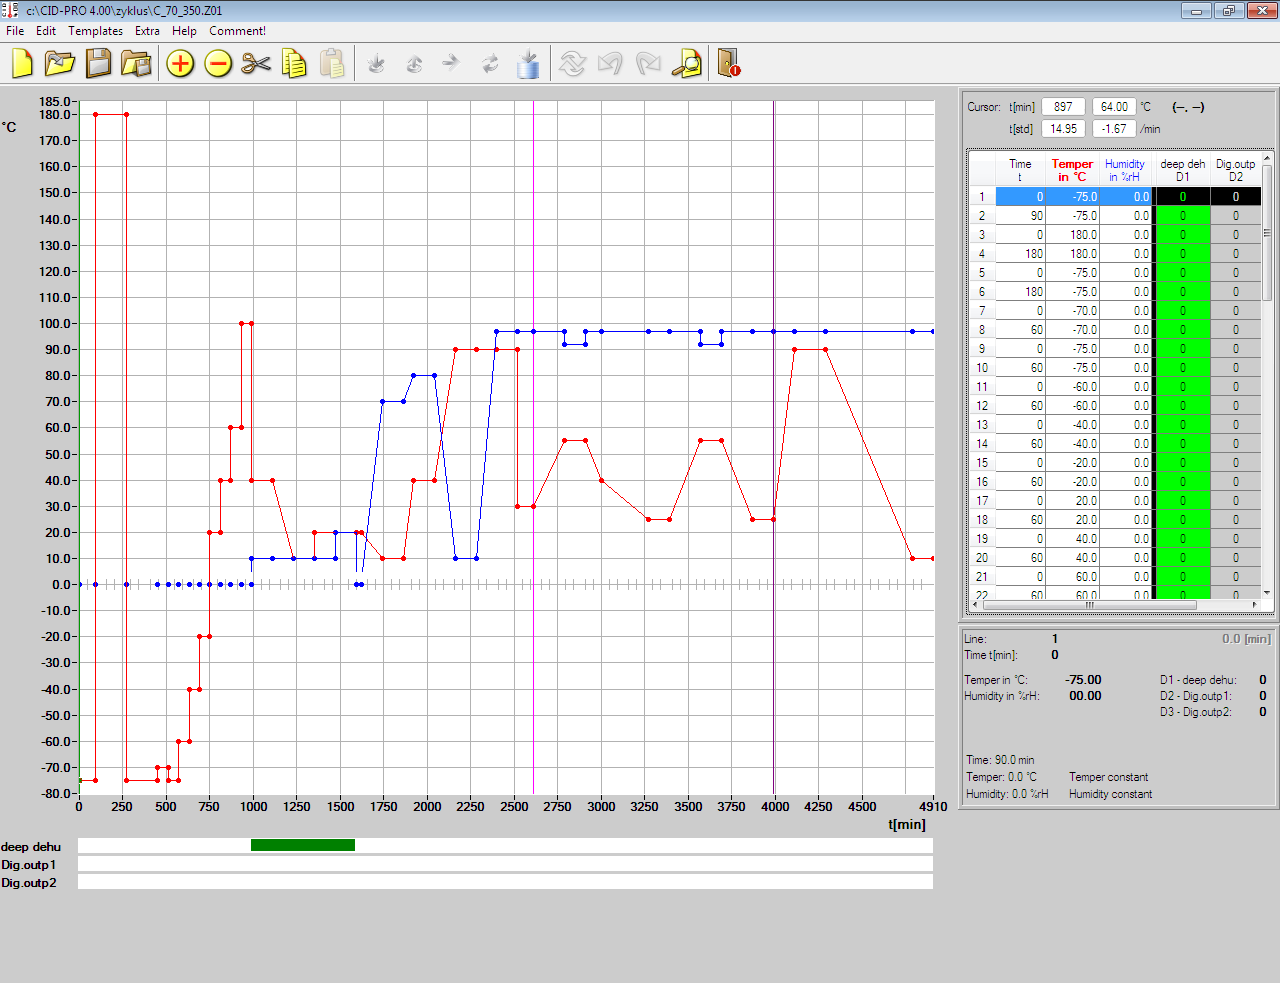
Graphical measurement data evaluation:
A record of the test cycle program can be created storing all analogue and digital channels. This data can be evaluated and the results imported into Microsoft® Excel if required.
- Display complete measurement results.
- Hide channels which are not to be displayed.
- Difference and duration can be calculated (evaluation with two cursors on the graph).
- Select real time displays (date and time) or relative information (e.g. minutes).
- Zoom a selected area to carry out more accurate evaluations.
- Zoom to 20 levels.
- The scaling of analogue channels can be displayed on the right or left in the graphic zone.
- Also display the cursor in the digital channels.
- Display all functions via symbols and menu bars. All symbols contain a tool text-description.
- Standard-configuration for the display of analogue and digital channels is selectable: The first 4 analogue and 4 digital channels have standard-set-actual-colours.
- The last measured results opened are loaded.
- Extended search for measuring files.
- Measured files for the same configurations can be combined.
- Optimized Microsoft® Excel export function with user changeable options.
- Show measurement results in a table (complete or within cursor positions).
- PDF printout resp. logging
Visualising:
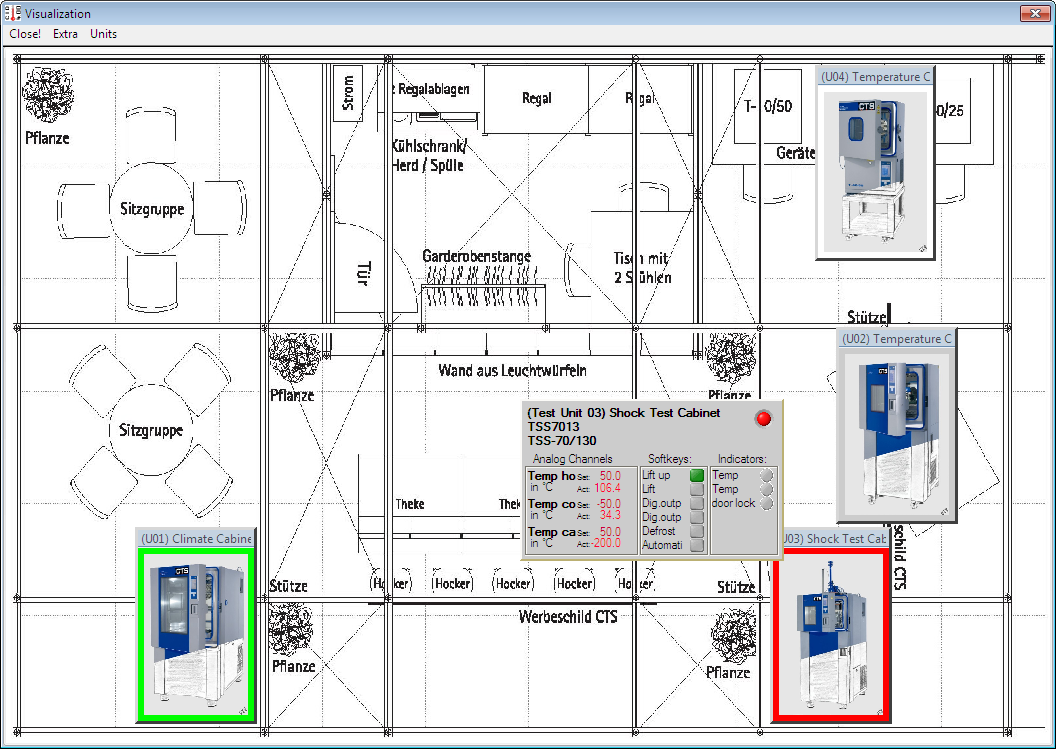
- With the new menus, there is the option to visually display the layout of your units with site layout background photos and pictures of the individual setups. Units can be configured with user-defined sizes, position and appearance.
- Key information is displayed when the cursor is moved over a chamber.
Networking:
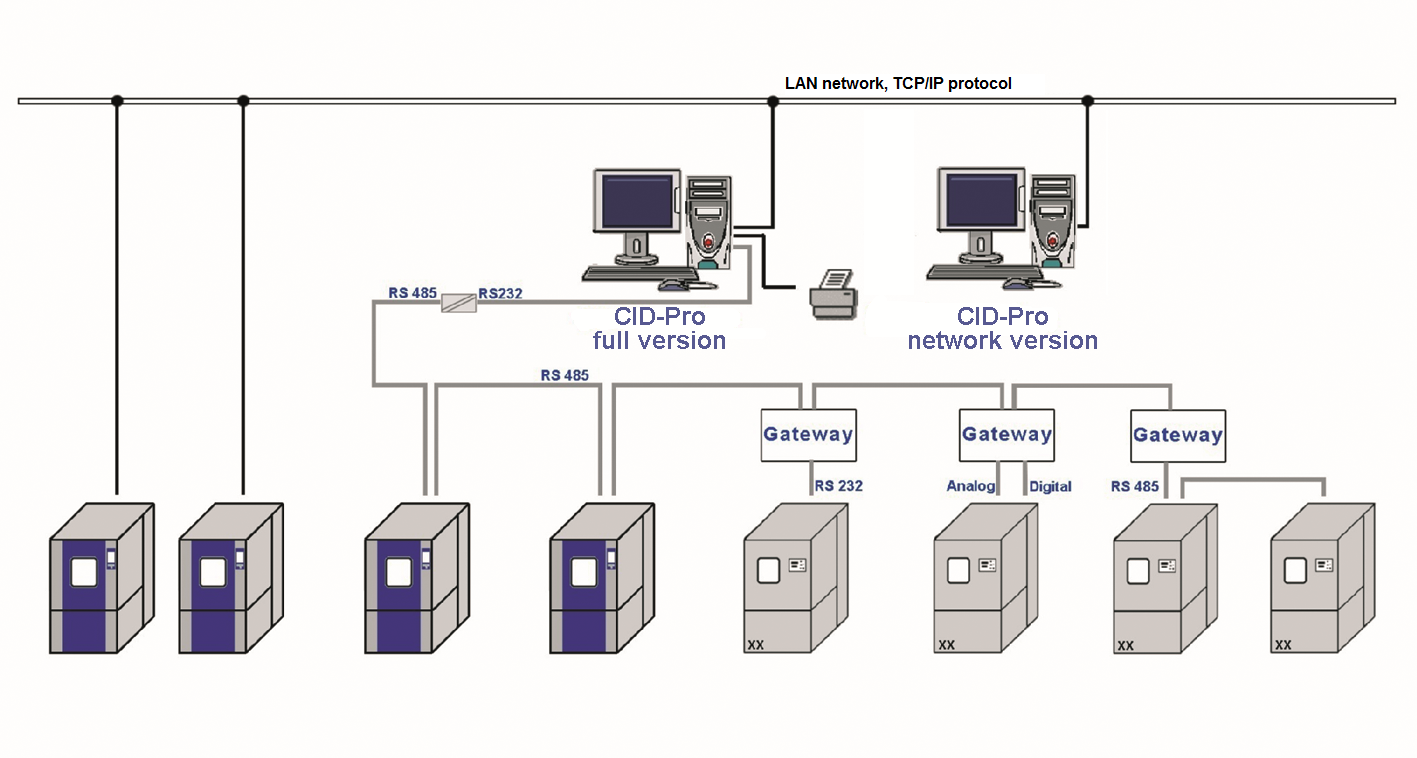
- Communication to the setup is freely configurable through RS232, RS485 or a network. Additionally, an online monitoring function is provided for other computers on the network.
Special menus for Temperature Shock-Test-Cabinets:
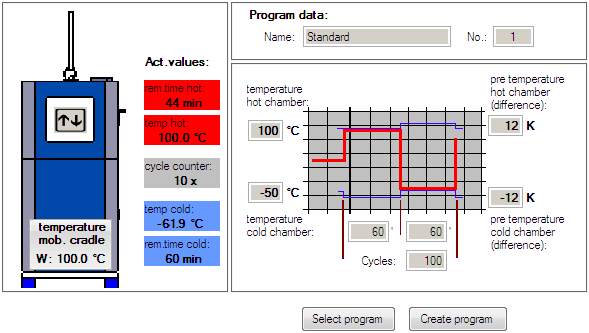
- A particularly clear display of the configuration with the special shock-test menu. The heating chamber, lower cold chamber or lift cage temperature - all information at a glance.
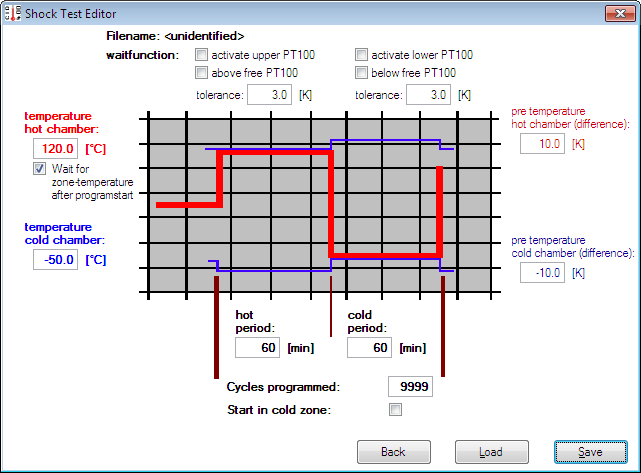
- With the shock test editor, standard shock test programs can be easily created.